Figure 15.9 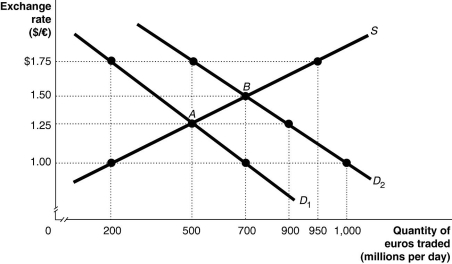 Alt text for Figure 15.9: In figure 15.9, a graph illustrates the quantity of euros traded against the exchange rate.
Long description for Figure 15.9: The x-axis is labelled, quantity of euros traded in millions per day.The y-axis is labelled, exchange rate, Canadian dollar against the euro.A straight line supply curve, S, slopes up from the bottom left corner to the top right corner.2 straight line demand curves, D1 and D2, slope down from the top left corner to the bottom right corner.Curve D2 is plotted to the right of curve D1.The difference between the curves is indicated by a right pointing arrow.Curve S intersects curves D1 and D2 at points A (500, 1.25) and B (700, 1.50) .Point (200, 1.00) is plotted near the bottom of curve S.Point (950, 1.75) is plotted near the top of curve S.Point (500, 1.75) is plotted near the top of curve D2.Points (900, 1.25) and point (1,000, 1.00) are plotted near the bottom of curve D2.Point (200,1.75) is plotted near the top of curve D1.Point (700, 1.00) is plotted near the bottom of curve D1.All points are connected to their corresponding values on the x and y-axes with dotted lines.
-Refer to Figure 15.9.The equilibrium exchange rate is at A, $1.25/euro.Suppose the European Central Bank pegs its currency at $1.00/euro.Speculators expect that the value of the euro will rise, and this shifts the demand curve for euros to D2.After the shift,
Definitions:
Accurate in Reality
Being true or correct in conformity with the actual state of things or conditions.
Case Study Method
A research method that involves the intensive examination of an individual or group to draw conclusions about a larger principle or phenomena.
Restricted Sample
A sample limited to specific criteria, often used in research to focus on a particular group or aspect.
Dream Analysis
A therapeutic technique best known in psychoanalysis where dreams are interpreted to uncover underlying motives and desires.
Q16: If the Bank of Canada's announcements about
Q23: Trade allows each person to specialize in
Q36: Because resources are scarce,a society cannot give
Q36: In international exchange markets,a rise in interest
Q58: Factors of production are<br>A) the mathematical calculations
Q99: In economics,the cost of something is<br>A) the
Q102: In 1991,Argentina decided to peg its currency
Q214: Which of the following would shift the
Q265: An increase in net foreign investment is
Q305: Suppose the government taxes the wealthy at