Figure 15.10 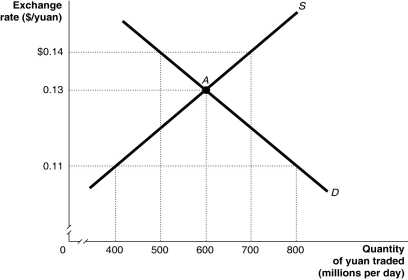 Alt text for Figure 15.10: In figure 15.10, a graph illustrates the quantity of yuan traded against the exchange rate.
Long description for Figure 15.10: The x-axis is labelled, quantity of yuan traded in millions per day.The y-axis is labelled, exchange rate, Canadian dollar against the yuan.Supply curve S, is a straight line which slopes up from the bottom left corner to the top right corner.Demand curve D, is a straight line which slopes down from the top left corner to the bottom right corner.The curves intersect at point A, (600, 0.13) .Point A, and unmarked points (800, 0.11) , (500, $0.14) , (700, $0.14) , and (400, 0.11) are all connected to their corresponding values on the x and y-axes with dotted lines.
-Refer to Figure 15.10.Suppose the Chinese government decides to abandon pegging the yuan to the Canadian dollar at a rate that overvalues the yuan.Using the figure above, the equilibrium exchange rate would be ________, and Chinese exports to Canada would ________ in price.
Definitions:
Fixed Factory Overhead Volume Variance
The difference between the budgeted and actual fixed overhead costs attributed to a variation in produced units volume.
Supervisors
Individuals who have the responsibility to oversee and direct the work of others, ensuring that tasks are completed effectively and efficiently.
Work Flow
The sequence of industrial, administrative, or other processes through which a piece of work passes from initiation to completion.
Nonfinancial Measures
Metrics used to assess performance and operations that do not involve monetary transactions, such as customer satisfaction or employee turnover rates.
Q64: Refer to Figure 14.4.The depreciation of the
Q72: Suppose after graduating from college you get
Q99: The simple circular-flow diagram is a model
Q104: What is the relationship between the balance
Q127: Suppose that a country that has a
Q217: When exchange rates are not determined in
Q257: If a country has a _ exchange
Q298: Oil is considered to be a non-renewable
Q325: Public policies<br>A) may be able to improve
Q515: With respect to how economists study the