Multiple Choice
Figure 4-19
The diagram below pertains to the demand for turkey in the United States. 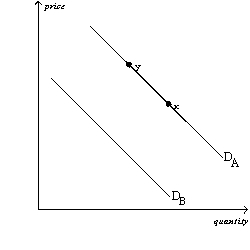
-Refer to Figure 4-19. All else equal, a decrease in the price of the grain fed to turkeys would cause a move from
Definitions:
Related Questions
Q117: An increase in quantity supplied<br>A) results in
Q125: Refer to Figure 4-6.If the demand curve
Q209: Refer to Table 3-7.Korea should specialize in
Q209: A surplus is the same as an
Q255: Refer to Figure 5-1.Between point A and
Q326: Refer to Figure 4-19.All else equal,buyers expecting
Q479: Suppose the price elasticity of supply for
Q497: A rightward shift of a supply curve
Q501: An increase in which of the following
Q532: A decrease in the price of a