Figure 8-19. The figure represents the relationship between the size of a tax and the tax revenue raised by that tax.
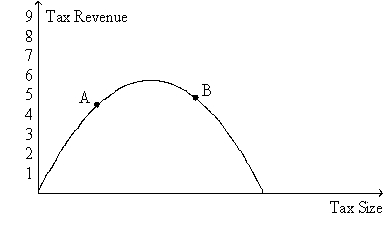
-Refer to Figure 8-19.If the economy is at point B on the curve,then a small decrease in the tax rate will
Definitions:
Nonexempt
Refers to employees who are covered by the minimum wage and overtime provisions of the Fair Labor Standards Act (FLSA).
Clerk
An administrative or office worker responsible for managing files, keeping records, and performing general clerical duties.
Consumer Price Index
A measure that examines the weighted average of prices of a basket of consumer goods and services, such as transportation, food, and medical care, typically used as an indicator of inflation.
Real Wages
The purchasing power of an individual's wages, taking into account inflation and cost of living.
Q32: The principle of comparative advantage asserts that<br>A)
Q71: Refer to Figure 8-10.Suppose the government imposes
Q89: Free trade causes job losses in industries
Q114: When a tax on a good is
Q215: If the labor supply curve is nearly
Q244: If Darby values a soccer ball at
Q305: Refer to Figure 9-10.With trade,the equilibrium price
Q348: In the market for widgets,the supply curve
Q396: Refer to Figure 8-11.Suppose Q<sub>1</sub> = 4;
Q410: In 1776,the American Revolution was sparked by