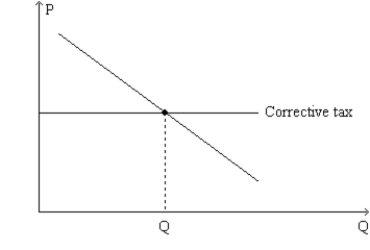
Figure 10-18. The graph represents a corrective tax to reduce pollution. On the axes, Q denotes the quantity of pollution and P represents the price of pollution. 
-Refer to Figure 10-18. The tax depicted on the graph
Definitions:
Organizational Solutions
Strategies or interventions designed to address and solve issues within a company or organization, leading to improved performance and outcomes.
Skills Model
A framework that outlines the capabilities, knowledge, and personal attributes necessary for successful leadership.
Leadership Competencies
A set of skills, knowledge, abilities, and behaviors necessary for effective leadership across various contexts and organizations.
Leadership Outcomes
The impacts or results derived from employing leadership strategies, including team performance, organizational success, and innovation.
Q38: Suppose that policymakers are doing cost-benefit analysis
Q210: The nation of Aviana soon will abandon
Q241: Refer to Table 10-6.If the government charged
Q253: When a country abandons a no-trade policy,adopts
Q302: Governments can grant private property rights over
Q302: Suppose a certain good conveys either an
Q322: Many species of animals are common resources,and
Q328: Refer to Scenario 9-2.Suppose the world price
Q341: Excessive fishing occurs because<br>A) each individual fisherman
Q428: Economists assume that the typical person who