Figure 12-9
The figure below depicts average total cost functions for a firm that produces automobiles. 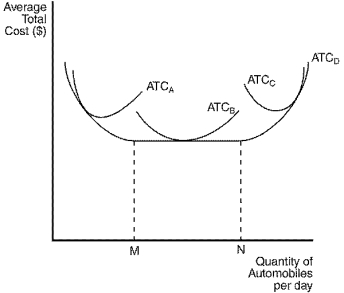
-Refer to Figure 12-9.At output levels greater than N,the firm experiences
Definitions:
Relatively Inelastic
Describes a situation where the demand or supply of a good or service changes minimally in response to changes in price.
Marginal Cost Curve
A graphical representation that shows how the cost of producing one additional unit of a good changes as production volume increases.
Marginal Revenue Curve
A graphical representation showing how a firm's revenue changes with each additional unit of output sold, typically declining in perfectly competitive markets.
Total Revenue Curve
A graph showing how total revenue changes as the quantity sold of a product or service changes, holding the price constant.
Q67: Depending on congestion,national parks can be either
Q68: The value of a business owner's time
Q105: The efficient scale of the firm is
Q267: Refer to Table 12-12.What is the marginal
Q321: In order to maximize profits in the
Q387: Refer to Table 12-6.Each worker at the
Q391: Consider a competitive market with 50 identical
Q399: The marginal product of an input in
Q407: Economic profit is equal to total revenue
Q462: Refer to Figure 13-6.When market price is