Figure 13-10
In the figure below,panel (a) depicts the linear marginal cost of a firm in a competitive market,and panel (b) depicts the linear market supply curve for a market with a fixed number of identical firms. 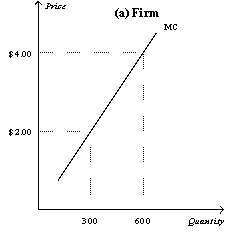
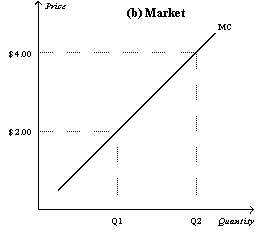
-Refer to Figure 13-10.If there are 500 identical firms in this market,what is the value of Q2?
Definitions:
Merchandising Company
A business that purchases finished goods for the purpose of resale without further processing.
Credit Sales
Sales made on credit, where payment is received after the goods or services are delivered.
Gross Profit
The difference between revenue and the cost of goods sold, indicating the efficiency of a company in producing and selling its products.
Operating Expenses
Costs associated with the day-to-day functioning of a business, such as rent, utilities, payroll, and materials, excluding the cost of goods sold.
Q52: Refer to Figure 13-9.If there are 400
Q213: A monopoly firm can sell 150 units
Q279: The entry of new firms into a
Q283: Because the goods offered for sale in
Q311: In a competitive market,the actions of any
Q335: A firm cannot price discriminate if<br>A) its
Q403: The Doris Dairy Farm sells milk to
Q409: Refer to Table 13-2.For a firm operating
Q410: If the profit-maximizing quantity of production for
Q520: In his book,An Inquiry into the Nature