Multiple Choice
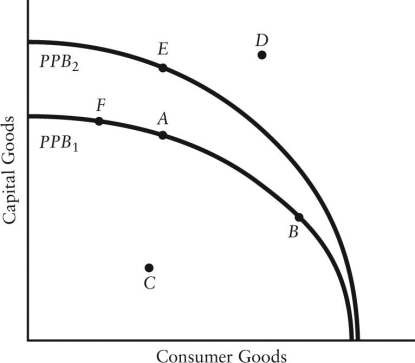
The diagram below shows two production possibilities boundaries for Country X.  FIGURE 1-4
-Refer to Figure 1-4.If Country X is currently producing at point A,it could move to point B if
Definitions:
Related Questions
Q7: What was the prior day's closing price
Q16: Consider Canada's production possibilities boundary.Suppose a scientific
Q70: You bought five call option contracts with
Q74: Money market instruments issued by a corporation:<br>A)are
Q79: Which one of the following had the
Q95: Briefly describe the basic elements of an
Q98: Suppose Statistics Canada reports that total income
Q121: Refer to Table 3-3.At a price of
Q138: Refer to Table 2-3.Between Year 1 and
Q149: Refer to Figure 4-1,which shows two demand