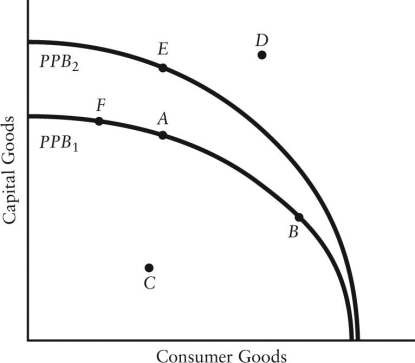
The diagram below shows two production possibilities boundaries for Country X.  FIGURE 1-4
-Refer to Figure 1-4.A shift of the production possibilities boundary from PPB1 to PPB2 implies
Definitions:
Constant Cost Industry
An industry wherein the costs of production do not change as the overall level of output increases or decreases.
Entry Barriers
Obstacles that prevent new competitors from easily entering an industry or area of business, including high startup costs, licensing requirements, and access to technology.
Zero Economic Profit
A situation where a firm's total revenue is exactly equal to its total opportunity costs, indicating no excess returns over the cost of capital.
Long Run
A period in which all factors of production and costs are variable, allowing for adjustments in production to meet changes in the market or economy.
Q17: The Aggressive Eastern Fund sold $167 million
Q22: Suppose that a bakeshop with 5 employees
Q26: Consider the following equation: Y = 10
Q29: Which one of the following statements is
Q33: Given a positively sloped supply curve,when market
Q34: When the offering price and the NAV
Q50: An economic system that relies primarily upon
Q54: Suppose there is a linear relationship between
Q63: When discussing types of economic systems the
Q73: Yvette recently purchased 500 shares of stock