Figure 1-7 shows the production possibilities boundary for an economy that produces two goods - cotton and bananas. 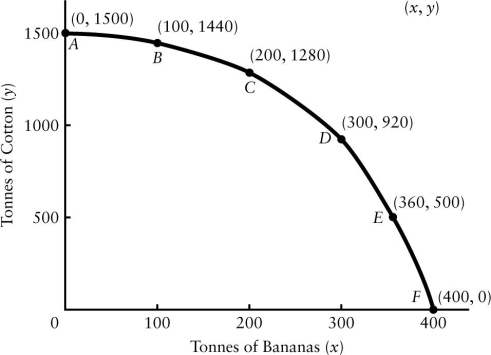 FIGURE 1-7
-Refer to Figure 1-7.A production possibilities boundary is shown for an economy that produces two goods - cotton and bananas,both measured in tonnes produced per year.Suppose this economy is currently producing 1280 tonnes of cotton and 200 tonnes of bananas.What is the opportunity cost of increasing production of bananas by 100 tonnes?
Definitions:
Additional Financing
Funds that are raised by a company through borrowing or issuing new equity, in addition to its existing capital.
Asset Turnover
A financial ratio that measures the efficiency of a company's use of its assets in generating sales revenue; the higher the turnover, the better.
Current Ratio
An indicator of a company's ability to meet short-term debt obligations; calculated by dividing current assets by current liabilities.
Fixed Assets
Fixed assets are long-term tangible assets that are used in the operations of a business and are not expected to be consumed or converted into cash within a year.
Q32: Refer to Figure 3-4.If the price of
Q42: Refer to Table 4-2.Using the data provided
Q48: One year ago,you purchased 300 shares of
Q66: A stock had year end prices of
Q67: The determination of which individual stocks to
Q68: ETFs are:<br>A)limited to diversified index funds.<br>B)generally held
Q72: You would like to have the right
Q104: In mixed economies,economic behaviour is<br>A)largely determined by
Q158: Which statement best describes a "demand schedule"?<br>A)a
Q160: Refer to Table 3-3.If the price in