Multiple Choice
The table below shows hypothetical per-minute cell phone charges for "pay-and-talk" service over several years.
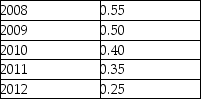 TABLE 2-2
-Refer to Table 2-2.Assume that 2008 is used as the base year,with the index number = 100.The value of the index number in 2012 is
Definitions:
Related Questions
Q17: If two goods,X and Y,have a negative
Q20: Refer to Figure 3-2.If the supply curve
Q45: Consider the global market for barley,an agricultural
Q54: What was the total price fluctuation on
Q61: You purchased a stock for $18.45 a
Q76: You purchased 800 shares of stock for
Q78: Refer to Figure 3-1.The movement along the
Q94: To say that the supply curve is
Q114: The elasticity of supply for some product
Q122: Positively related variables change such that as