The table below displays hypothetical demand and supply schedules for the market for overnight parcel deliveries in Canada.
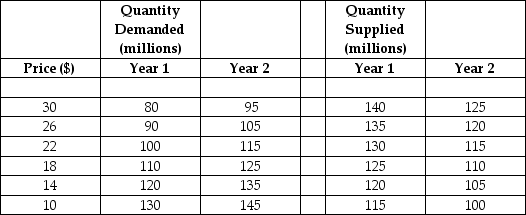 TABLE 3-4
-Refer to Table 3-4.Which of the following statements best describes the change in equilibrium price and quantity in this market between Year 1 and Year 2?
Definitions:
Substitutes
Goods or services that can be used in place of each other, where an increase in the price of one leads to an increased demand for the other.
Income Elasticity
A measure of how much the quantity demanded of a good changes in response to a change in consumers' income.
Demand Inelastic
When the quantity demanded of a good or service is relatively unchanged in response to price changes.
Directly Related
A situation where two variables move in the same direction, meaning if one increases, the other also increases and vice versa.
Q16: In indifference curve analysis,the consumer's utility-maximizing point
Q22: If the graph of a function is
Q36: Refer to Figure 5-4.Suppose the government sets
Q47: Refer to Figure 1-1.If the government chooses
Q61: In Canada we have government intervention in
Q80: Suppose that the price of wheat has
Q106: The key decision makers in a market
Q107: Refer to Table 6-2.Assuming Dave maximizes his
Q112: A minimum permissible price established by the
Q160: Which of the following situations could explain