Multiple Choice
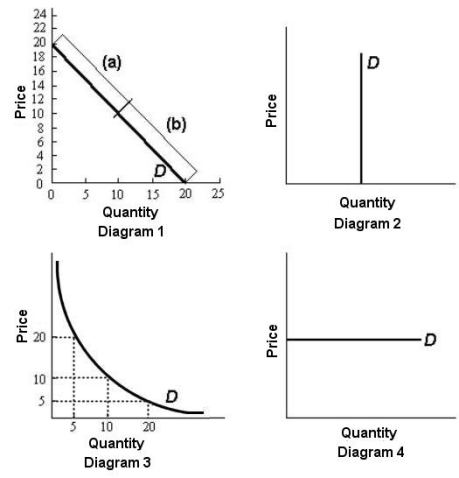 FIGURE 4-2
-Refer to Figure 4-2.In diagram 1,the elasticity of demand over the price range $12 to $14 is
Definitions:
Related Questions
Q22: Refer to Table 4-1.Between the prices of
Q40: A demand curve is a representation of
Q51: Which of the following statements about the
Q76: Income elasticity measures the change in quantity
Q78: Refer to Table 7-4.The marginal product of
Q87: A straight-line production possibilities boundary differs from
Q88: Refer to Figure 1-2.What is the price
Q106: Refer to Figure 6-2.Suppose the price of
Q112: Suppose an index of average prices of
Q113: When considering how a family's level of