Solved
FIGURE 4-2 -Refer to Figure 4-2.As Price Decreases,total Expenditure Increases,reaches a Maximum,and
Multiple Choice
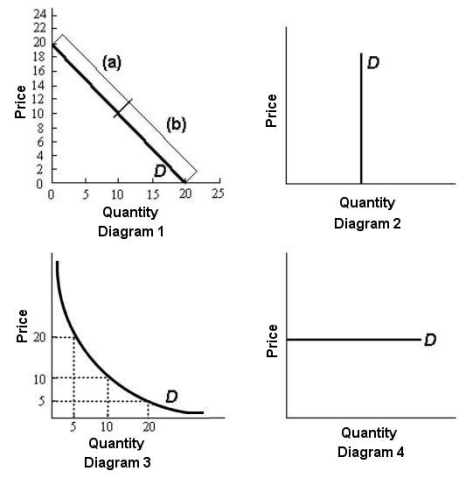 FIGURE 4-2
-Refer to Figure 4-2.As price decreases,total expenditure increases,reaches a maximum,and then decreases for the demand curve in diagram(s)
Definitions:
Related Questions
Q15: Refer to Table 7-5.What is the average
Q33: A greater specialization of labour leads to
Q57: In a co-ordinate graph,with Y on the
Q62: Refer to Figure 4-3,which shows a demand
Q71: According to the Bank of Canada's website,Canada's
Q75: The opportunity cost to a firm of
Q98: Suppose Statistics Canada reports that total income
Q102: Refer to Table 4-3.The income elasticity of
Q116: When a plant is operating at the
Q129: Refer to Figure 4-2.In diagram 1,the elasticity