Multiple Choice
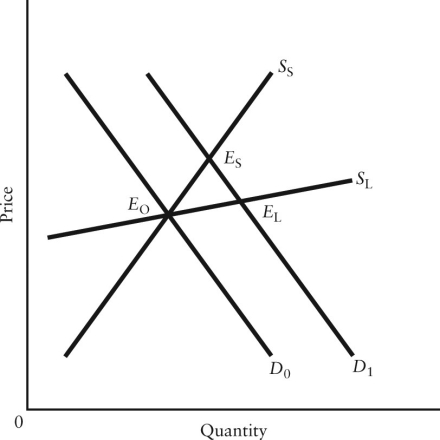 FIGURE 4-3
-Refer to Figure 4-3,which shows a demand shift and the short-run and long-run supply curves for some good.The diagram illustrates the general principle that
Definitions:
Related Questions
Q3: Refer to Figure 6-8.The movement of the
Q14: Which of the following represents a typical
Q30: Refer to Figure 3-3.At a price of
Q30: On a coordinate graph with y on
Q46: Choose the statement that best describes how
Q55: The base year for an index number
Q89: Refer to Figure 2-3.The slope of curve
Q101: Consider the market for iron ore,an important
Q109: Refer to Figure 5-3.Suppose P<sub>3</sub> represents a
Q118: Refer to Figure 5-2.A price ceiling set