Multiple Choice
Diagrams A,B,and C show 3 individual consumers' demand curves for cement.Consumers A,B,and C constitute the entire monthly cement market in this region. 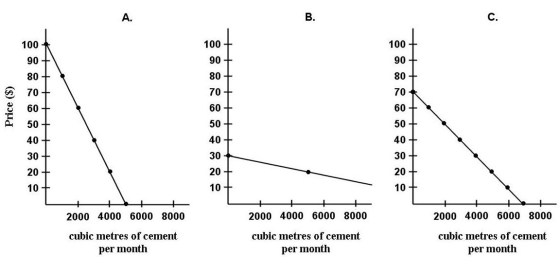 FIGURE 6-3
-Refer to Figure 6-3.What is the market demand (in cubic metres per month) for cement at a price of $20 per cubic metre?
Definitions:
Related Questions
Q13: Assume a firm is using 10 units
Q34: When a corporation issues a bond<br>A)the purchaser
Q57: Refer to Figure 6-2.Suppose the price of
Q73: Refer to Figure 3-5.Ceteris paribus,if demand were
Q82: A firm that has two or more
Q89: When economists describe a market for a
Q103: The price of a good or a
Q122: Short-run cost curves for a firm are
Q130: Refer to Figure 7-1.The marginal product of
Q161: Suppose there is a decrease in the