Diagrams A,B,and C show 3 individual consumers' demand curves for cement.Consumers A,B,and C constitute the entire monthly cement market in this region. 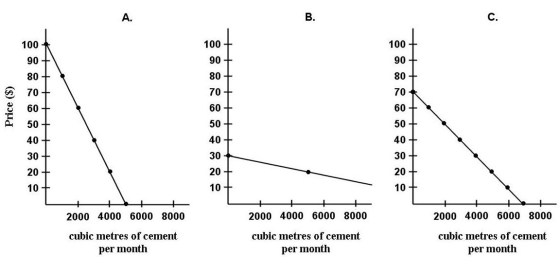 FIGURE 6-3
-Refer to Figure 6-3.On the regional market demand curve for cement (not shown) ,at which price level(s) is there a "kink" in the demand curve?
Definitions:
Repeated Games
A strategic scenario in which the same game or situation is played multiple times, allowing for strategy evolution based on past outcomes.
Simultaneous
Occurring, operating, or done at the same time.
Sequential Decision
A process of making decisions one after another, where each decision is dependent on the outcome of previous decisions.
Collusion
An agreement, usually secretive, between two or more parties to limit competition, set prices, or manipulate market conditions.
Q3: Refer to Figure 6-8.The movement of the
Q3: In the long run,decreasing returns to scale
Q15: Refer to Table 7-5.What is the average
Q27: Consider a market that is in equilibrium
Q55: When a firm's total-product curve is increasing
Q56: Refer to Table 3-1.The equilibrium price for
Q76: Suppose Commercial Footwear Inc.is making a cost-minimizing
Q96: Refer to Figure 3-5.The price at which
Q110: For a price floor to be binding,it
Q114: Choose the best description of an "equilibrium