The figure below shows a family of cost curves for a firm.The subscripts 1,2,and 3 for the SRATC curves refer to different plant sizes. 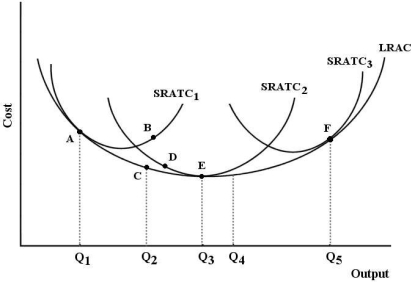 FIGURE 8-3
-Refer to Figure 8-3.Suppose this firm is producing output level Q3 with plant size 2.Now suppose this firm changes to plant size 3 and is producing output level Q5.We can say that
Definitions:
Unimportant Assignments
These are tasks or projects deemed to have little value or priority in the context of broader goals or objectives.
Strong Performer
An individual or entity that consistently achieves or exceeds performance expectations in a given area.
Fundamental Attribution Error
A bias in social psychology where people tend to attribute others' actions to their character or personality, while attributing their own behaviors to external factors.
Insider Trading
The illegal activity of trading a public company's stock or other securities by individuals with access to non-public, material information.
Q9: A monopoly is distinguished from a firm
Q35: Refer to Figure 8-3.If this firm is
Q50: Refer to Figure 8-6.At each of points
Q78: Refer to Figure 11-3.If an increase in
Q79: Consider the following characteristics of a particular
Q91: Which of the following paired concepts are
Q92: If a perfectly competitive firm produces at
Q106: Refer to Figure 6-2.Suppose the price of
Q107: Refer to Figure 11-3.A monopolistically competitive firm
Q122: A change in the technique for producing