Multiple Choice
The diagram below shows the short-run cost curves for 3 perfectly competitive firms in the same industry. 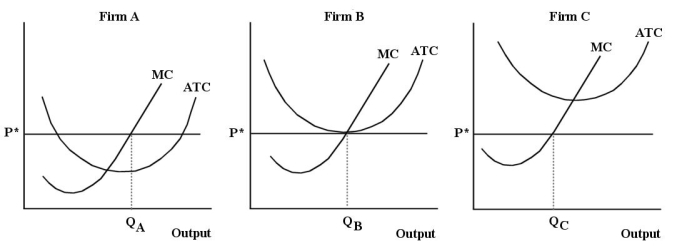 FIGURE 9-6
-Refer to Figure 9-6.Which firm or firms is likely to exit this industry?
Definitions:
Related Questions
Q35: For a given market price,a perfectly competitive
Q69: Consider a firm that uses only labour
Q73: Suppose a firm employs two kinds of
Q76: Refer to Table 10-1.For a single-price monopolist,the
Q77: The theory of oligopoly suggests that<br>A)entry into
Q79: A firm's short-run marginal cost curve is
Q80: Prior to the 1986 amendments to the
Q99: Which of the following is a possible
Q100: Non-monetary considerations tend to be most important
Q137: By expressing the cost-minimizing condition as MP<sub>K</sub>/MP<sub>L</sub>