The diagram below shows the short-run cost curves for 3 perfectly competitive firms in the same industry. 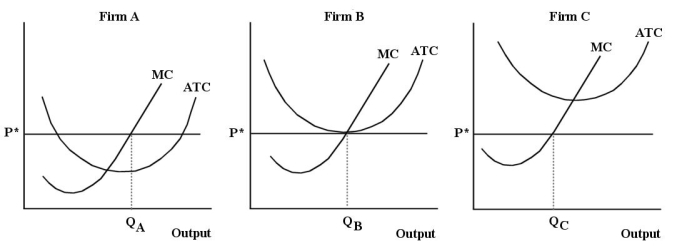 FIGURE 9-6
-Refer to Figure 9-6.Given that Firms A,B and C are in the same industry,is this industry in long-run equilibrium?
Definitions:
Supply Curve
A graphical representation showing the relationship between the quantity of goods that producers are willing to sell and the price of those goods.
Relatively Elastic
Describes a situation where the quantity demanded or supplied of a good or service changes significantly in response to a change in price.
Total Revenues
The total income generated by a company from its sales of goods or services before any expenses are subtracted.
Q46: For many firms the LRAC curve is
Q47: The choices listed below involve costs to
Q62: A firm is said to have "market
Q63: An ineffective means of discouraging the entry
Q67: What information is displayed by an isoquant?<br>A)the
Q78: Refer to Figure 12-5.If output in this
Q80: The total value that Doug places on
Q81: In the long run,a profit-maximizing firm producing
Q93: Refer to Figure 8-3.Suppose this firm is
Q114: The hypothesis of equal net advantage explains