The figure below shows the demand schedule and demand curve for a product produced by a single-price monopolist. 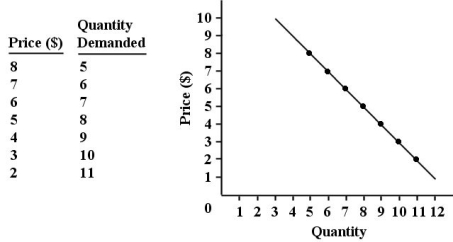 FIGURE 10-1
-Refer to Figure 10-1.Suppose this single-price monopolist is initially selling 5 units at $8 each and then reduces the price of the product to $6.By making this change,the firm is giving up revenue of ________ on the original number of units sold and gaining revenue of ________ on the additional units sold.Its marginal revenue is therefore ________.(All figures are dollars.)
Definitions:
Printer
A device that transfers text and graphics from a computer onto paper or other media, producing physical copies of digital documents.
Internet
A global network of computers and servers that allows for the exchange of data, communication, and access to information across the world.
ROM Chips
Non-volatile memory chips that permanently store instructions for computing devices; ROM stands for Read-Only Memory.
Virtual Memory
A memory management capability of an operating system that uses hardware and software to allow a computer to compensate for physical memory shortages, temporarily transferring data from RAM to disk storage.
Q17: Refer to Table 8-1.Which production technique is
Q32: Many clothing retailers allow you to go
Q47: Refer to Table 13-4.If plotted on a
Q47: Refer to Table 6-3.If the price of
Q62: The main argument of Joseph Schumpeter's idea
Q87: Suppose there are many independent dry cleaners
Q103: Farmer Anna is producing tomatoes in a
Q105: Regulation can reduce the profits of a
Q113: Refer to Figure 8-5.The firm that is
Q124: Suppose a firm is producing 250 units