The diagram below shows the demand curve facing a single-price monopolist. 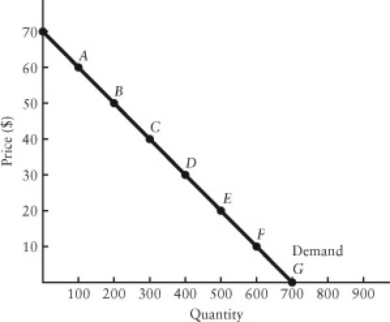 FIGURE 10-4
-Refer to Figure 10-4.What is the firm's marginal revenue per unit as it moves from point C to point D on the demand curve?
Definitions:
Discount Rate
The interest rate used to discount future cash flows to their present value, often reflecting the risk associated with the cash flows.
Projected Dividends
The estimated dividends a company plans to pay out to its shareholders in the future.
EPS Growth Rate
The percentage change in a company's Earnings Per Share (EPS) over a specified period, indicating the company's profitability growth.
Rate of Return
The gain or loss of an investment over a specified period, expressed as a percentage of the investment's cost.
Q4: The period of time over which the
Q22: Both empirical evidence and everyday observation suggest
Q28: Consider a perfectly competitive firm in the
Q39: Refer to Table 10-2.If the firm were
Q54: Refer to Figure 9-1.The diagram shows cost
Q58: When economists say that a perfectly competitive
Q87: Refer to Table 13-1.Diminishing marginal returns are
Q88: An oligopolistic firm often detects a change
Q92: Refer to Table 7-2.The implicit costs for
Q93: Which of the following characteristics is NOT