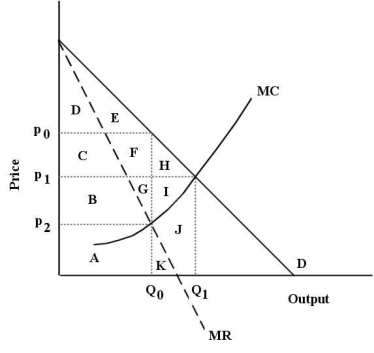
The diagram below shows the demand curve and marginal cost and marginal revenue curves for a new heart medication for which the pharmaceutical firm holds a 20-year patent on its production and sales.This protection gives the firm monopoly power for the 20 years of the patent.  FIGURE 10-6
-Refer to Figure 10-6.Assume this pharmaceutical firm charges a single price for its drug.At its profit-maximizing level of output,consumer surplus is represented by
Definitions:
Algorithm
A methodical, logical rule or procedure that guarantees solving a particular problem. Contrasts with the usually speedier—but also more error-prone—use of heuristics.
Trial and Error
A problem-solving method involving repeated, varied attempts which are continued until success is achieved or the agent stops trying.
Heuristic
A simple thinking strategy that often allows us to make judgments and solve problems efficiently; usually speedier but also more error-prone than algorithms.
Heuristics
Mental shortcuts or rules of thumb that simplify decision making, often used in problem-solving and judgment situations.
Q5: Certain professions limit the number of students
Q12: Refer to Figure 14-4.The wage paid by
Q25: Refer to Figure 12-7.Suppose this firm is
Q42: Oligopolists make decisions after taking into account
Q65: Allocative efficiency is a property of the
Q68: A firm operates at its least-cost position
Q74: Suppose your firm is a monopsonist hiring
Q115: An important unanswered question about the role
Q118: Refer to Figure 12-1.Suppose each of Firms
Q129: A perfectly competitive firm's demand curve coincides