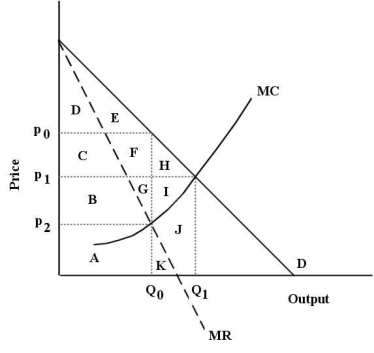
The diagram below shows the demand curve and marginal cost and marginal revenue curves for a new heart medication for which the pharmaceutical firm holds a 20-year patent on its production and sales.This protection gives the firm monopoly power for the 20 years of the patent.  FIGURE 10-6
-Refer to Figure 10-6.Assume this pharmaceutical firm has no fixed costs and is practicing perfect price discrimination among its buyers.At its profit-maximizing level of output,it will generate a total profit represented by
Definitions:
Viral Carcinogen
A virus capable of causing cancer by inducing uncontrolled cell growth through the infection of host cells.
Physical Carcinogen
A substance or exposure that physically causes cancer to develop in living tissue.
Familial Carcinogenesis
The process by which cancer is formed, influenced, or increased due to genetic predispositions within families.
Staging Classifications
Systems used in medicine to categorize the extent and severity of a patient's disease or condition.
Q2: The presence of significant scale economies in
Q2: Refer to Figure 13-1.This firm's MRP curve
Q6: Refer to Table 9-3.What is the marginal
Q6: Refer to Figure 12-1.Suppose each of Firms
Q32: Refer to Figure 12-5.At the free-market equilibrium,consumer
Q41: Refer to Figure 10-5.A profit-maximizing single-price monopolist
Q59: Refer to Figure 11-3.In the long run,a
Q62: The main argument of Joseph Schumpeter's idea
Q135: Refer to Table 7-4.Marginal product of labour
Q135: In order to decide the appropriate output