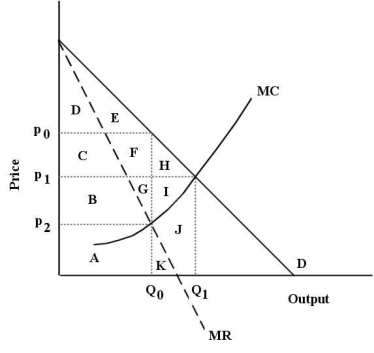
The diagram below shows the demand curve and marginal cost and marginal revenue curves for a new heart medication for which the pharmaceutical firm holds a 20-year patent on its production and sales.This protection gives the firm monopoly power for the 20 years of the patent.  FIGURE 10-6
-Refer to Figure 10-6.Suppose this pharmaceutical firm is charging a single price for its drug and is maximizing its profits.If it then begins to perfectly price discriminate among its buyers it will
Definitions:
Confederates
Individuals who are part of an experiment but pretend to be participants, often used to manipulate social interactions within the experiment.
Sociogram
A visual representation or diagram that maps the relationships and social interactions within a group.
Self-report Measures
Self-report measures are assessment tools where individuals provide subjective feedback about their own feelings, behaviors, or attitudes.
Covert Observational Measures
Covert observational measures refer to methods used in research to observe and gather data on subjects' behavior without them being aware of the observation, ensuring natural behavior is recorded.
Q4: The average union wage premium in Canada
Q5: Refer to Table 7-6.The firm's marginal product
Q32: Many clothing retailers allow you to go
Q34: Price discrimination,if possible,allows a price-setting firm to
Q42: Suppose a perfectly competitive firm is producing
Q78: Refer to Figure 14-1.Suppose the employers in
Q80: One prediction about monopolistic competition is that
Q93: Consider two firms,A and B,that are producing
Q118: In the short run,the firm's product curves
Q124: A perfectly competitive firm is currently producing