The diagram below shows selected cost and revenue curves for a firm in a monopolistically competitive industry. 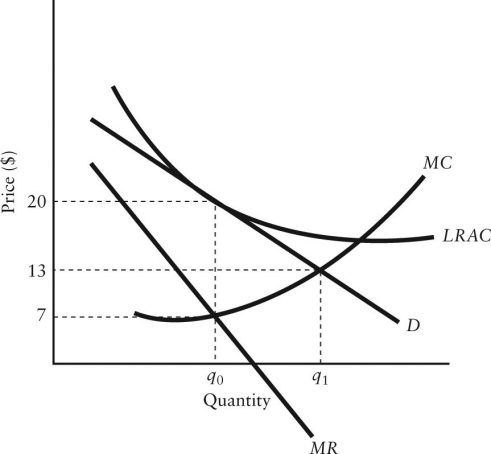 FIGURE 11-4
-Refer to Figure 11-4.How is the excess-capacity theorem demonstrated in this diagram?
Definitions:
Relative Purchasing Power Parity
A theory that states the rate of appreciation or depreciation of one currency relative to another will equal the rate of inflation differentials between the two countries.
Expected Inflation
The rate at which the general level of prices for goods and services is rising, and subsequently, purchasing power is expected to fall.
Absolute Purchasing Power Parity
A theory that suggests that the price of goods in different countries should be equal when measured in a common currency.
Exchange Rate
The price of one country's currency in terms of another currency or currencies.
Q22: The point of tangency between the short-run
Q38: Consider a firm in a perfectly competitive
Q41: Refer to Figure 10-5.A profit-maximizing single-price monopolist
Q49: To a monopsonist in a labour market,the
Q73: One attempt to provide some minimum level
Q73: Refer to Table 9-2.At what price would
Q90: Suppose a typical firm in a competitive
Q101: The long-run average cost curve is an
Q104: Refer to Figure 12-7.Suppose this firm is
Q124: Consider a profit-maximizing single-price monopolist that faces