The diagram below shows selected cost and revenue curves for a firm in a monopolistically competitive industry. 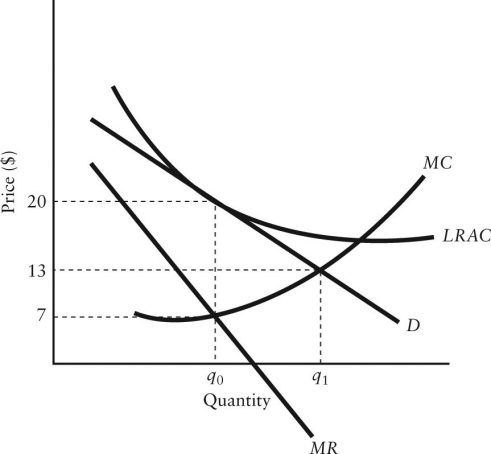 FIGURE 11-4
-Refer to Figure 11-4.Assuming this firm is producing its profit-maximizing level of output,what are the profits or losses being earned by this firm?
Definitions:
Sales Department
A division of a business responsible for all activities related to the sale of the company's products or services, including marketing, sales strategy, and customer interaction.
Direct Method
A cost allocation technique that assigns support department costs directly to producing departments without any intermediate allocation steps.
Janitorial Department
A dedicated division within an organization responsible for cleaning and maintaining the premises.
Cost Allocated
The process of distributing indirect costs to different departments, products, or projects within an organization.
Q2: Refer to Figure 9-2.The short-run supply curve
Q7: The economy's supply curve for saving (financial
Q29: Suppose the market for some product can
Q29: For any firm operating in any market
Q32: The creation of a new product is
Q42: Suppose a perfectly competitive firm is producing
Q67: Refer to Figure 14-4.Suppose the workers in
Q98: Which of the following statements concerning long-run
Q107: Refer to Table 13-4.What is the marginal
Q143: Refer to Figure 9-5.If Firm X has