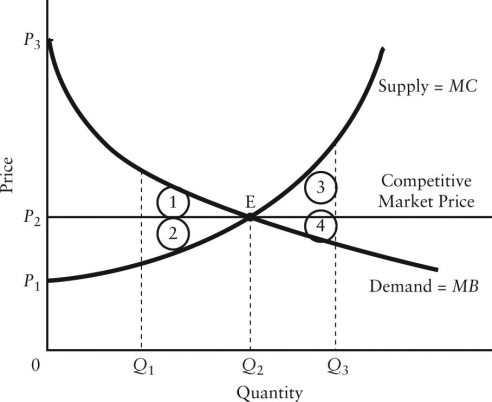
The diagram below shows the demand and supply curves in a perfectly competitive market.  FIGURE 12-5
-Refer to Figure 12-5.In the free-market equilibrium,producer plus consumer surplus is maximized and is illustrated by the area
Definitions:
Marginal Social Cost
The total cost society bears for the production of an additional unit of a good or service, including both external and private costs.
Coal Mine Pollution
Environmental contamination resulting from the operation of coal mines, including air and water pollution.
Marginal Social Cost
The total cost society bears for the production of an additional unit of a good, including both private costs and any external costs.
Production Process
A series of steps that involves the transformation of raw materials into finished products.
Q2: Refer to Figure 9-2.The short-run supply curve
Q5: If joint profits are to be maximized
Q10: Refer to Table 13-1.The marginal revenue product
Q16: Refer to Figure 13-3.Consider oil tankers as
Q21: Consider an industry that is monopolistically competitive.In
Q70: Which of the following best explains why
Q99: If a minimum wage is set above
Q127: Refer to Table 9-2.What is the marginal
Q134: Given the usual assumptions about perfect competition,a
Q142: Refer to Figure 9-4.Given its total cost