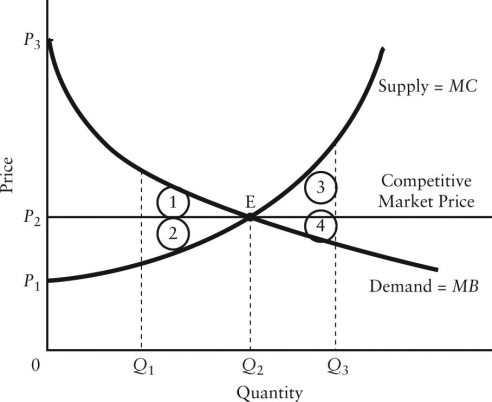
The diagram below shows the demand and supply curves in a perfectly competitive market.  FIGURE 12-5
-Refer to Figure 12-5.If output in this market were Q1,the total loss in economic surplus relative to the competitive equilibrium would be illustrated by area
Definitions:
Mergers
The combination of two or more companies into a single corporate entity, with the goal of achieving efficiencies, market expansion, or enhanced competitiveness.
Billion-Dollar Mergers
Large-scale corporate amalgamations where the total value, assets, or market cap involved reaches or exceeds one billion dollars.
Exxon And Mobil
Two major American oil companies that merged in 1999 to form ExxonMobil, one of the world's largest publicly traded oil and gas companies.
U.S. Justice Department
A U.S. government federal executive department tasked with the enforcement of laws and the administration of justice.
Q9: A Lorenz curve shows the<br>A)degree of inequality
Q23: If a perfectly competitive firm is faced
Q48: Consider the following characteristics of a particular
Q55: Productive efficiency for an individual firm requires
Q56: Suppose you are working as an intern
Q82: On a graph showing a firm's TC
Q82: When comparing a perfectly competitive firm and
Q85: The law of diminishing marginal returns tells
Q98: An imperfectly competitive industry is often allocatively
Q110: Refer to Table 10-1,which displays the demand