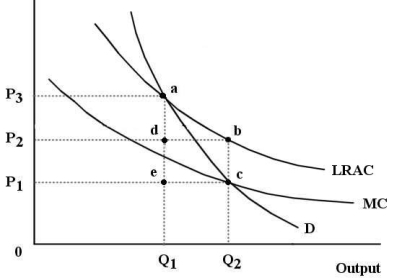
The diagram below shows the market demand curve and the cost curves for a single firm.  FIGURE 12-6
-Refer to Figure 12-6.Suppose this firm is being regulated using a policy of average-cost pricing.In this case,
Definitions:
Herfindahl Index
A measure of the size of firms in relation to the industry and an indicator of the amount of competition among them, calculated by squaring the market share of each firm within the industry and then summing the total.
Vertical Merger
A merger between two companies that operate at different stages of the production process for a specific product.
Kentucky Fried Chicken
A global fast-food restaurant chain that specializes in fried chicken, commonly known by its acronym KFC.
Vertical Merger
The combination of two or more companies at different stages of production in the same industry.
Q12: Consider a small firm that is producing
Q39: Suppose there is a competitive market for
Q48: The present value of a given future
Q49: Refer to Table 13-4.Which of the following
Q73: Refer to Figure 12-7.If this firm were
Q78: Suppose a paper mill in Quebec is
Q91: Consider a firm making a decision to
Q107: Refer to Table 9-3.If this firm were
Q117: In what way can an oligopolistic market
Q153: Suppose a typical firm in a competitive