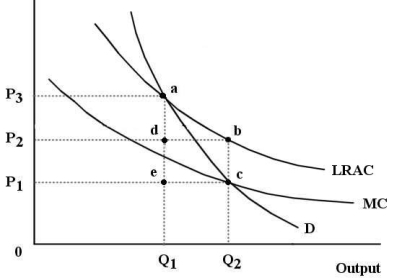
The diagram below shows the market demand curve and the cost curves for a single firm.  FIGURE 12-6
-Refer to Figure 12-6.Suppose this firm is being regulated using a policy of marginal-cost pricing.To maintain the resulting level of output
Definitions:
National Debt
The full amount of capital that a country's political authority has borrowed through a range of means.
Economic Growth
An increase in the production of goods and services in an economy over a period, often measured by GDP growth.
Budget Deficits
The situation that occurs when a government spends more money than it receives in revenue over a specific period of time.
Federal Budget Deficits
The financial situation where the U.S. government's expenditures exceed its revenues within a fiscal year.
Q5: Certain professions limit the number of students
Q6: Refer to Figure 11-3.If a decrease in
Q11: Kobe Bryant is a highly paid professional
Q20: Refer to Figure 11-4.Assuming this firm is
Q60: Households' supply of financial capital is derived
Q74: If pollution is associated with the production
Q86: Refer to Figure 12-3.If the diagram is
Q98: An imperfectly competitive industry is often allocatively
Q112: Refer to Figure 10-6.Assume this pharmaceutical firm
Q121: When the firms in an oligopoly are