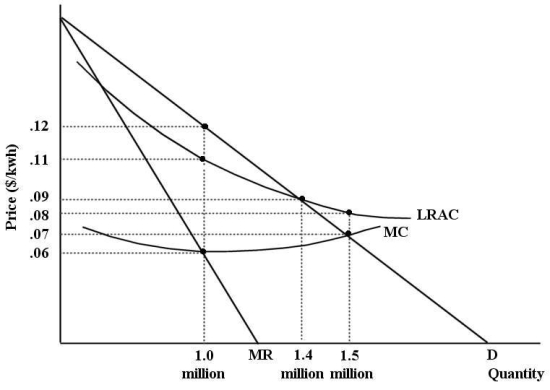
The diagram below shows cost and revenue curves for a natural monopoly producing electricity.Price is dollars per kilowatt hour and quantity is kilowatt hours per day.  FIGURE 12-7
-Refer to Figure 12-7.If this firm were unregulated and profit maximizing,its price and output would be ________ per kwh and ________ kwh per day.
Definitions:
Effect On Sales
The impact or change in the volume of sales as a result of a specific action or market condition.
Collectible
Items that are valued and sought after by collectors due to their rarity, condition, beauty, or personal emotional connection.
Tangible Assets
Physical assets that can be seen and touched, such as buildings, machinery, and vehicles, in contrast to intangible assets like patents or trademarks.
Short-Term Assets
Assets expected to be converted into cash, sold, or consumed within one year or the normal operating cycle, whichever is longer.
Q23: Consider an example of the prisoner's dilemma
Q32: Refer to Figure 11-4.How is the excess-capacity
Q56: One reason movie theatres charge a lower
Q74: Refer to Figure 9-1.The diagram shows cost
Q75: Refer to Figure 13-4.Assume that all four
Q76: The concept of moral hazard was publicly
Q78: Refer to Figure 12-5.If output in this
Q79: Refer to Figure 10-5.This single-price monopolist would
Q105: Regulation can reduce the profits of a
Q152: Suppose a perfectly competitive firm is producing