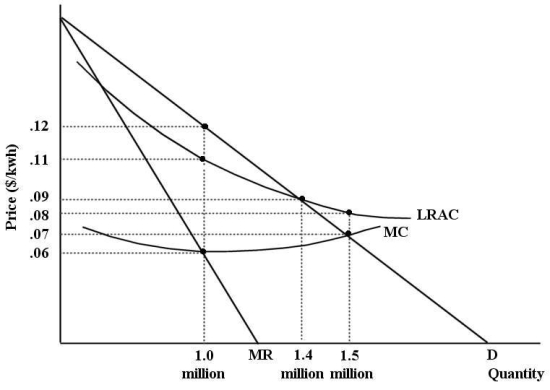
The diagram below shows cost and revenue curves for a natural monopoly producing electricity.Price is dollars per kilowatt hour and quantity is kilowatt hours per day.  FIGURE 12-7
-Refer to Figure 12-7.If this firm were unregulated and profit maximizing,its price and output would be ________ per kwh and ________ kwh per day.
Definitions:
Development Tools
Software or hardware tools that aid in the creation, testing, and maintenance of products or systems.
Experiments
Systematic and scientific procedures carried out under controlled conditions to discover an unknown effect, to test or establish a hypothesis, or to illustrate a known effect.
Preselling
The practice of offering products or services for sale before they are released or available, to gauge customer interest and secure funding.
Crowdfunding
The process of raising funding for a new venture from a large audience (the “crowd”), typically through the Internet.
Q42: Suppose that you lend me $100 for
Q49: A monopolistically competitive firm and a monopoly
Q49: In a free-market economy,<br>A)temporary shortages and surpluses
Q71: Refer to Table 15-2.If the interest rate
Q87: Refer to Figure 9-1.The diagram shows cost
Q90: Refer to Figure 15-2.Suppose the economy begins
Q94: Suppose Harrison Ford makes 2 movies per
Q107: Refer to Table 13-4.What is the marginal
Q131: The price elasticity of demand faced by
Q144: Suppose your trucking firm in a perfectly