The diagram below shows the MRP curve for a firm producing copper plumbing pipe.The factor of production being considered here is hours of labour. 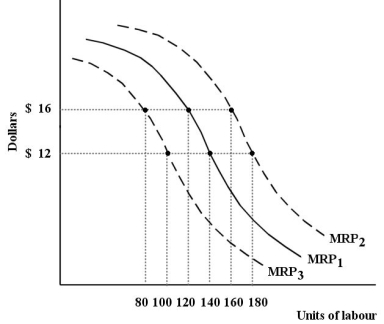 FIGURE 13-1
-Refer to Figure 13-1.Suppose this firm is facing MRP1,a wage rate of $16 per hour and is employing 100 units of labour.At this level of employment,
Definitions:
Q1: Refer to Figure 13-4.The panel that best
Q15: Refer to Figure 12-4.If a disequilibrium price
Q20: The textbook presentation of present value involves
Q24: The optimal amount of pollution abatement is
Q53: Suppose a dairy farmer is considering the
Q60: Suppose an advertising firm purchases additional insurance
Q66: Monopoly is allocatively inefficient because<br>A)the price exceeds
Q91: Consider a firm making a decision to
Q104: Refer to Table 13-1.The total revenue of
Q109: Which of the following characteristics is NOT