The three diagrams below show the supply and demand for teenage babysitters in one local area.The initial supply curve is S0 in all cases. 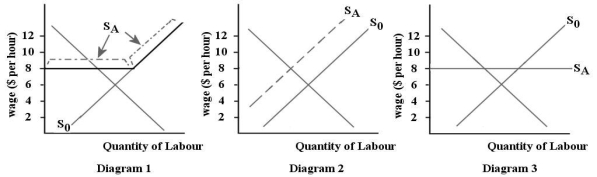 FIGURE 14-3
-Refer to Figure 14-3.Suppose all of the teenage babysitters in one local area form an association and set a minimum age of 16 for working as a babysitter.Which diagram illustrates the new supply curve (SA) for babysitters?
Definitions:
Time-Driven Activity-Based Costing
An accounting method that assigns costs to products based on the time employees spend on each activity involved in its production or service.
Order Fulfillment Department
A division within a company responsible for processing and delivering orders to customers.
Customer Cost Analysis
A process that evaluates all costs associated with acquiring and retaining customers, aiming to optimize profitability and identify cost-saving opportunities.
Time-Driven Activity-Based Costing
A refinement of activity-based costing that assigns costs to products or services based on the time resources are expected to use.
Q1: The Canadian government introduced the Tax-Free Savings
Q26: Refer to Figure 14-2.Suppose the labour market
Q44: Refer to Figure 12-6.The firm depicted in
Q53: If a monopolist is practicing perfect price
Q67: Refer to Figure 11-2.In diagram D,the profit-maximizing
Q69: Under what circumstances would it be efficient
Q78: In Canada,the corporate income tax is integrated
Q87: Refer to Table 17-1.Suppose a public authority
Q92: Refer to Figure 12-2.Suppose demand and supply
Q119: Suppose the technology of an industry is