The diagram below shows demand and supply curves for some perfectly competitive market. 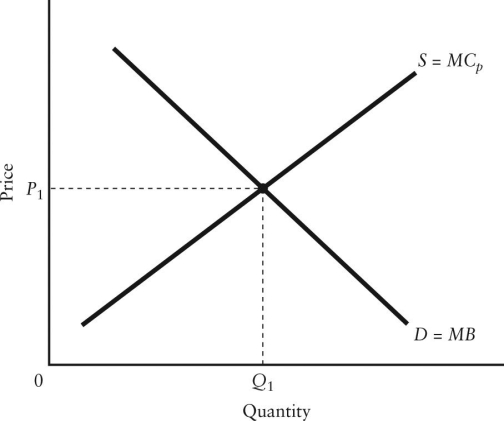 FIGURE 16-2
-Refer to Figure 16-2.Suppose that the marginal benefit curve (MB) includes all social benefits and that there is a positive externality in production.In this case,________ for allocative efficiency.
Definitions:
Q7: The economy's supply curve for saving (financial
Q21: Refer to Figure 17-4.Suppose the government requires
Q36: The "informal defence" of free markets includes
Q40: Why might it be economically efficient to
Q46: Refer to Figure 17-5.Suppose Firm 1 and
Q48: The administrative agency established to enforce the
Q72: Suppose a piece of capital equipment will
Q74: Suppose taxes are levied in the following
Q79: To compare the economy's aggregate output in
Q84: What is the approximate measure (2014 data)of