The diagram below shows the supply and demand diagrams for the competitive market for honey in one region.MC0 represents private marginal cost and MB0 represents private marginal benefit. 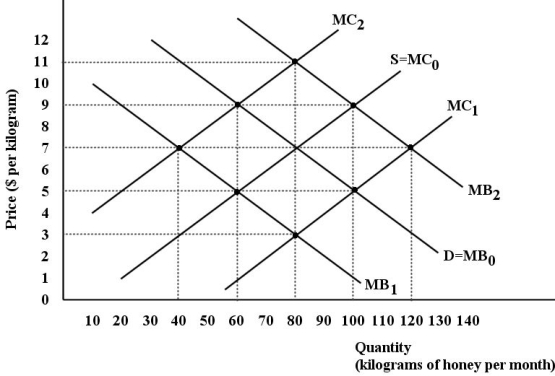 FIGURE 16-3
-Refer to Figure 16-3.Assume there are two types of firms in this region - beekeepers that produce honey and orchard keepers that produce peaches.The bees provide a benefit to the orchard keepers by pollinating their peach trees.If the external marginal benefit is $4 per unit of honey,then what is the allocatively efficient output?
Definitions:
Social Network Use
The extent and manner in which individuals engage with social networking platforms to communicate, share, or consume content.
Emotionally Stable
A psychological state in which an individual can manage their emotions and remain calm and composed under stress.
Introverted
A personality trait characterized by a focus on internal feelings rather than external sources of stimulation.
Research
Research is the systematic investigation into and study of materials and sources in order to establish facts and reach new conclusions.
Q5: Consider a firm producing car parts in
Q17: The real interest rate must be<br>A)high if
Q43: Refer to Figure 15-2.The market for financial
Q59: A firm's demand for physical capital leads
Q87: In Canada,students' tuition fees for post-secondary education
Q92: In an otherwise efficient market,an excise tax
Q93: In general,a profit-maximizing firm will purchase a
Q100: Refer to Figure 12-3.If the diagram is
Q109: Refer to Figure 14-6.The market begins in
Q111: Refer to Table 17-1.Suppose a public authority