The diagram below shows the marginal costs of pollution abatement for two firms,Firm 1 and Firm 2. 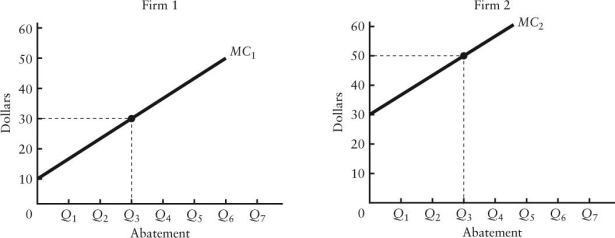 FIGURE 17-5
-Refer to Figure 17-5.Suppose Firm 1 and Firm 2 are each abating Q3 units of pollution.If the government imposes an emissions tax of $20 per unit of emissions,
Definitions:
Ethical Leader
A leader who prioritizes ethical considerations and moral integrity in decision-making and influences others to do the same.
Organization Strengthens
The process of a company or institution enhancing its capabilities and resources to achieve its goals.
Leader-Member Exchange Model
A theory highlighting the importance of the relationship between leaders and team members in determining organizational outcomes.
Unique Working Relationships
Distinctive interpersonal connections at the workplace characterized by originality in interactions, dynamics, or mutual expectations.
Q3: As a seller of labour services,a labour
Q9: Governments continue to provide public support to
Q29: Since 1960 in Canada,the rate of inflation
Q29: Refer to Table 20-6.What is the real
Q60: Households' supply of financial capital is derived
Q65: Refer to Figure 17-3.On the horizontal axis,the
Q73: One attempt to provide some minimum level
Q82: When assessing a tax system,"vertical equity" refers
Q95: The "size distribution of income" refers to
Q118: Refer to Figure 21-1.If disposable income is