The diagram below shows supply and demand diagrams (S and D) for some product.The government then imposes an excise tax.The new supply curve is  .
. 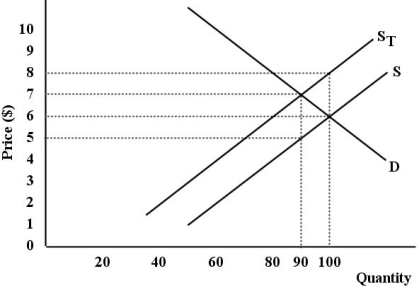 FIGURE 18-4
-Refer to Figure 18-4.What is the value of the tax imposed on this product,in dollars per unit?
Definitions:
Substitution Effect
The change in the quantity demanded of a good that results from a change in price, making the good more or less expensive relative to other goods.
Consumer Behavior
The study of individuals, groups, or organizations and the processes they use to select, secure, use, and dispose of products, services, experiences, or ideas to satisfy needs.
Equilibrium
A state where supply and demand balance each other, and as a result, prices become stable.
MU/P
Marginal Utility per Price, a concept in economics that represents the additional utility or satisfaction obtained per unit of expenditure.
Q2: On a graph showing real national income
Q18: Suppose there is a competitive market for
Q45: In 2015,the federal income-tax rate was graduated
Q52: Refer to Table 19-1.In the year 2014,it
Q53: Consider a simple macro model with demand-determined
Q60: Between 1995 and 2011,Canada's greenhouse gas emissions
Q85: The law of diminishing marginal returns tells
Q89: Suppose an employer and its employees enter
Q96: If the cyclical unemployment rate is negative,then
Q115: An important unanswered question about the role