The diagram below shows desired aggregate expenditure for a hypothetical economy.Assume the following features of this economy:
∙ marginal propensity to consume (mpc) = 0.75
∙ net tax rate (t) = 0.20
∙ no foreign trade
∙ fixed price level
∙ all expenditure and income figures are in billions of dollars. 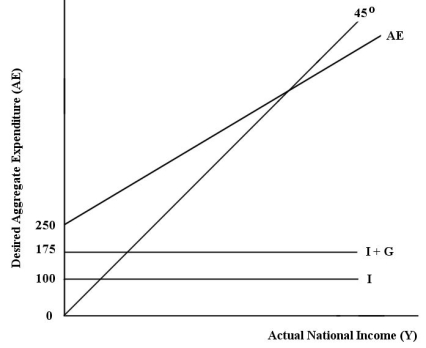 FIGURE 22-2
-Refer to Figure 22-2.What is total autonomous expenditure?
Definitions:
Production Process
The method or series of actions taken to manufacture, create, or produce goods and services.
Basic Scientific Research
Fundamental investigations aimed at acquiring new knowledge without a particular application or use in mind.
Commercially Viable
Describes a product, service, or business that can generate enough revenue to cover its costs and yield a profit.
Federal Law
Legislation passed by the national government of the United States that applies throughout the country.
Q21: Refer to Figure 24-1.If the economy is
Q24: According to the Neoclassical growth model,which of
Q27: Refer to Table 19-1.What is the output
Q63: Which of the following statements about output
Q64: Refer to Table 21-2.The marginal propensity to
Q97: Refer to Table 21-8.This economy's equilibrium level
Q102: Refer to Table 21-7.This economy's equilibrium level
Q108: Consider the basic AD/AS macro model in
Q110: The aggregate expenditure (AE)function is an upward-sloping
Q122: A movement along the net export (NX)function