The diagram below shows desired aggregate expenditure for a hypothetical economy.Assume the following features of this economy:
∙ marginal propensity to consume (mpc) = 0.80
∙ net tax rate (t) = 0.15
∙ no foreign trade
∙ fixed price level
∙ all expenditure and income figures are in billions of dollars. 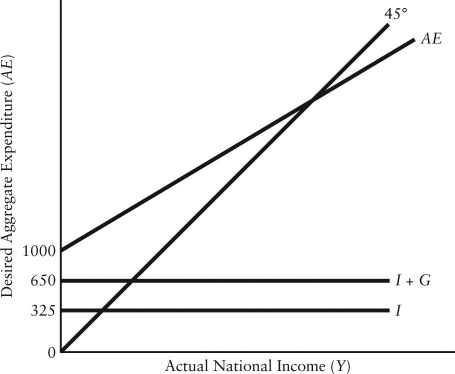 FIGURE 22-3
-Refer to Figure 22-3.What is total autonomous expenditure?
Definitions:
Value Chain
The full range of activities that businesses go through to bring a product or service from conception to delivery and beyond.
Distribution Channel
The pathway through which goods or services travel from the producer to the end consumer, possibly involving intermediaries.
Situation Assessment
The process of evaluating the current state of an environment, context, or situation, to inform decision-making and strategic planning.
Q14: Consider a macro model in which output
Q35: If a country transfers resources from the
Q48: Suppose actual output is less than potential
Q49: The Smith family's disposable income rose from
Q90: What do we mean in our current
Q91: Suppose disposable income for an entire economy
Q107: Suppose Honest Rob's Used Cars buys a
Q109: For firms or individual households,desired expenditure is<br>A)always
Q125: Refer to Figure 21-1.If disposable income is
Q137: Refer to Figure 24-1.If the economy is