The diagram below shows desired aggregate expenditure for a hypothetical economy.Assume the following features of this economy:
∙ marginal propensity to consume (mpc) = 0.80
∙ net tax rate (t) = 0.15
∙ no foreign trade
∙ fixed price level
∙ all expenditure and income figures are in billions of dollars. 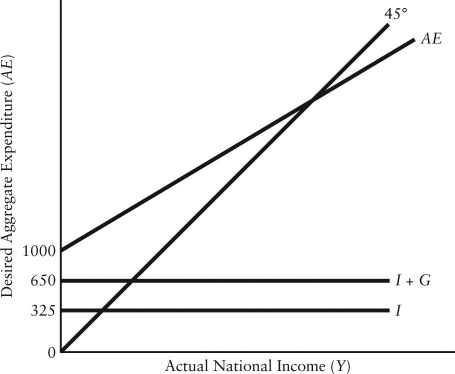 FIGURE 22-3
-Refer to Figure 22-3.Which of the following equations describes the aggregate expenditure function for this economy?
Definitions:
Q2: Refer to Figure 22-4.The rotation from AE<sub>0</sub>
Q21: Which of the following best explains the
Q25: If the price level is taken as
Q29: Refer to Table 20-6.What is the real
Q46: A change in the Consumer Price Index
Q60: Consider the following macro model with demand-determined
Q74: Consider a simple macro model with a
Q85: The five pillars of Canadian social policy
Q95: Aggregate demand (AD)shocks have a smaller effect
Q121: A decrease in the value of the