The diagram below shows desired aggregate expenditure for a hypothetical economy.Assume the following features of this economy:
∙ marginal propensity to consume (mpc) = 0.80
∙ net tax rate (t) = 0.15
∙ no foreign trade
∙ fixed price level
∙ all expenditure and income figures are in billions of dollars. 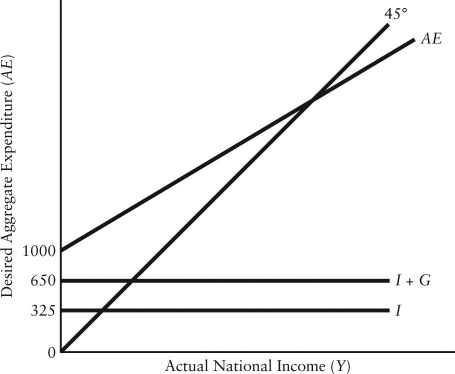 FIGURE 22-3
-Refer to Figure 22-3.What is the marginal propensity to spend (z) in this economy?
Definitions:
Pluralistic Ignorance
A psychological state where a majority of group members privately reject a norm, but assume incorrectly that most others accept it.
New Bar
a recently established establishment that serves alcoholic beverages and often other types of drinks and sometimes food.
Cooperating
The act of working together towards a common goal or purpose, often requiring compromise or collaboration.
Common Goal
An objective or purpose shared by multiple individuals or groups, aiming to achieve a mutual outcome.
Q8: Consider the circular flow of expenditure and
Q23: Consider the simplest macro model with demand-determined
Q41: Given current limitations,fiscal policy as a macroeconomic
Q51: Which of the following statements about the
Q56: In macroeconomics,the consumption function<br>A)and the aggregate expenditure
Q59: Suppose aggregate output is demand-determined.If the business
Q105: Consider a simple macro model with demand-determined
Q107: The paradox of thrift does not exist
Q108: On a graph showing real national income
Q113: Balanced growth of labour and capital in