The diagram below shows desired aggregate expenditure for a hypothetical economy.Assume the following features of this economy:
∙ marginal propensity to consume (mpc) = 0.75
∙ net tax rate (t) = 0.20
∙ no foreign trade
∙ fixed price level
∙ all expenditure and income figures are in billions of dollars. 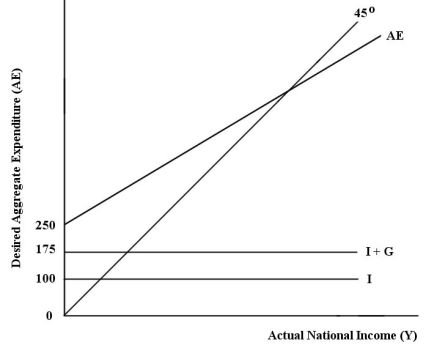 FIGURE 22-2
-Refer to Figure 22-2.What is the equilibrium national income in this economy?
Definitions:
Budgeted Sales
An estimated amount of sales in units or dollars that a company plans to achieve during a certain period, often used for planning and operational purposes.
Finished Goods Inventory
Finished goods inventory consists of items that have completed the manufacturing process and are ready for sale.
Raw Materials Inventory
The stock of basic materials that are used in the production process but have not yet been processed.
Raw Material Purchases
The cost associated with acquiring raw materials needed for production.
Q14: Consider a macro model in which output
Q24: To calculate GDP from the income side,one
Q26: Welfare recipients are sometimes faced with a
Q36: Refer to Figure 22-2.What is the level
Q47: Consider the basic AD/AS macro model in
Q86: When calculating GDP from the expenditure side,"actual
Q88: Consider a small economy with 2500 employed
Q111: Consider a closed economy with real GDP
Q111: Registered Retirement Savings Plans (RRSPs)operate whereby<br>A)Canadians contribute
Q125: Consider the competing products made by Apple