The diagram below shows an AD/AS model for a hypothetical economy.The economy begins in long-run equilibrium at point A. 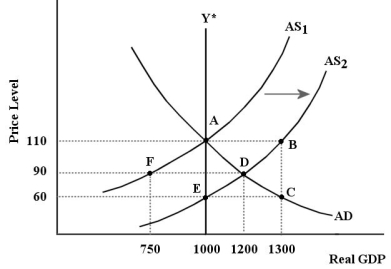 FIGURE 24-4
-Refer to Figure 24-4.After the positive aggregate supply shock shown in the diagram,which of the following would shift the AS curve leftward during the economy's adjustment process?
Definitions:
Seasonal Products
Items whose demand fluctuates according to the time of year, often influenced by seasons or holidays.
Distribution Manager
A professional responsible for overseeing the process of moving goods from production locations to points of sale and distribution.
Labor Productivity
A measure of economic performance that compares the amount of goods and services produced with the inputs used to produce them, particularly labor hours.
Centralized Inventory
An approach in inventory management where all stock is kept in a single location, simplifying operations and potentially reducing costs.
Q20: For a given level of technology,a more
Q54: In our simple macro model with government,which
Q56: If there are just two assets,bonds and
Q75: Consider a simple macro model with demand-determined
Q97: Refer to Table 21-8.This economy's equilibrium level
Q98: Consider a simple macro model with a
Q99: Refer to Table 21-5.The equilibrium level of
Q113: Monetary equilibrium occurs when the<br>A)growth in the
Q132: Refer to Figure 21-2.The amount of desired
Q142: Refer to Figure 24-2.Suppose the economy is