The table below shows the percentage of the labour force accounted for by males and females over a two-decade period.Assume that real GDP is equal to potential in each of the given years.
% of Labour Force
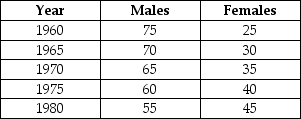 TABLE 30-4
-Refer to Table 30-4.Suppose that for each year listed the unemployment rate among males is 5% while it is 7% among females.By how much does this economy's NAIRU change between 1960 and 1975?
Definitions:
Ribbon Glacier
A type of long, narrow glacier, usually formed in mountain terrains, resembling a ribbon in aerial views.
Elevation
The height of a point or object measured from a specific level, typically sea level.
Tarn
A small lake, especially one within a cirque, a glacially scoured depression.
Depression
A low point or area in the Earth's surface, which can be caused by various geological processes such as erosion or tectonic movements.
Q5: A rightward shift of the AD curve
Q21: Any policy designed to benefit domestic industries
Q27: Suppose there is an inflationary gap and
Q34: Refer to Table 32-1.There is no scope
Q60: Refer to Figure 29-1.A constant rate of
Q62: Refer to Figure 30-1.The economy begins with
Q104: Suppose the current inflation rate is 4%
Q111: When the Bank of Canada reduces the
Q116: Consider a central bank that chooses to
Q117: An increase in the rate of aggregate