The diagram below shows two budget deficit functions for a hypothetical economy. 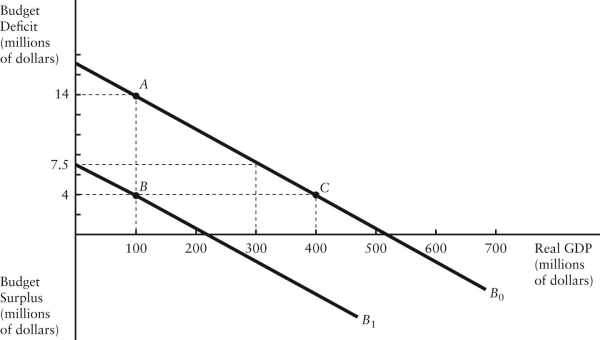 FIGURE 31-2
-Refer to Figure 31-2.Initially,suppose real GDP is $100 million and the budget deficit is $14 million,as shown by point A.Which of the following events could result in a move from point A to point C?
Definitions:
Accounts Payable
Liabilities or amounts owed by a business to its creditors for goods and services that have been received but not yet paid for.
Accounts Receivable
Financial obligations of customers to a firm for items or services rendered but not yet compensated.
Face Value
Refers to the nominal or dollar value printed on a financial instrument, such as a bond or stock certificate, representing its legal value.
Bond
An interest-bearing security that obligates the issuer to pay the bondholder a specified sum of money, generally at fixed intervals, and to repay the principal at maturity.
Q1: Consider a country that is operating under
Q3: The budget deficit function is graphed with
Q11: It is not possible for one country
Q16: An expansionary monetary policy by the Bank
Q26: For Canada,the term "exchange rate," as used
Q35: The overnight interest rate is crucial to
Q50: In 1980,the annual inflation rate in Canada
Q84: Refer to Figure 33-3.If the Canadian government
Q98: The view that sustained inflation is possible
Q112: If,as market-clearing theories of the labour market