The following production possibilities schedule shows the quantities of soybeans and oil that can each be produced in Canada and Mexico with one unit of equivalent resources.
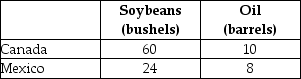 TABLE 32-3
-Refer to Table 32-3.The opportunity cost of a barrel of oil in Canada is
Definitions:
Quantity Supplied
The inventory of products or services that is put up for sale by producers at a specified rate.
Price
The amount of money required to purchase a good or service in the market.
Supply Curve
The supply curve is a graphical representation showing the relationship between the price of a good or service and the quantity of that good or service that a supplier is willing and able to supply.
Nonprice Determinants
Factors that affect demand or supply but are not related to the price of the good or service, such as consumer preferences or production technology.
Q1: Assume your salary is $2000 per month
Q7: An inflation that begins as a result
Q17: Economists would tend to accept which of
Q19: There can be strong pressure on the
Q31: Refer to Figure 32-1.If Ireland and Japan
Q73: Consider two economies,A and B.Economy A has
Q84: Assuming that the economy is currently in
Q85: Suppose the official rate of unemployment reported
Q103: Decreasing government expenditures in order to reduce
Q156: The difference between the payments and receipts