The figure below shows the demand curve, marginal revenue curve, marginal cost curve and average total cost curve for a monopolist. 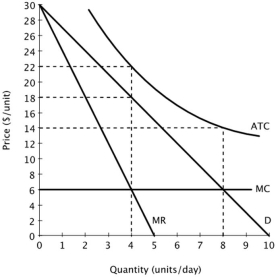 At this monopolist's profit-maximizing level of output, it:
Definitions:
Investment Amounts
The total funds allocated by individuals or businesses towards investment vehicles like stocks, bonds, or real estate for the purpose of earning returns.
Required Rate
The minimum return or yield that investors expect to receive on an investment, taking into account the risk level and market conditions.
Cost of Capital
The rate of return a company must earn on its investments to satisfy its investors or lenders.
Hurdle Rate
The minimum rate of return that an investment project must generate before it is considered viable or attractive for investment.
Q1: Standards are recommendations relating to a policy.
Q2: A(n)_ is a construct of systems,personnel,applications,protocols,technologies,and policies
Q10: Suppose a monopolist faces the demand curve
Q24: _ is a type of social engineering
Q27: Casey earns $150 a week and consumes
Q32: _ is the process of giving the
Q41: Joe is the owner of the 7-11
Q42: If a firm spends $400 to produce
Q65: Assume that each day a firm uses
Q128: A seller's supply curve shows the seller's:<br>A)willingness