The figure below shows a single consumer's demand for ice cream at the student union. 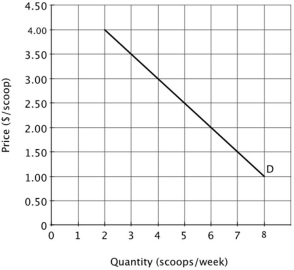 Fran is one of the students whose demand curve for ice cream is shown above. When price is $4.00, Fran demands ______ scoops a week, and when price is $2.00, Fran demand ______ scoops.
Definitions:
Electrical Energy
Energy that is made available by the flow of electric charge through a conductor.
Heart Attack and Stroke
Medical conditions where heart attack is the interruption of blood supply to a part of the heart, causing heart cells to die, and stroke is the interruption of blood supply to the brain, leading to brain damage.
Stress
The body's response to any demand for change, whether physical, mental, or emotional.
SPECT
A type of nuclear imaging test that shows how blood flows to tissues and organs, using a radioactive substance and a special camera.
Q4: The No-Cash-on-the-Table Principle states that there are:<br>A)never
Q33: At his current level of consumption, Evan
Q37: The figure below shows Becky's daily production
Q39: You can spend $5 for lunch and
Q48: Ginger and Maryann are lost in the
Q67: The price elasticity of demand for a
Q70: The figure below shows Becky's daily production
Q99: The inputs used to produce cupcakes (e.g.,
Q105: Refer to the figure below. Moving from
Q123: Suppose Chris is a potter who